
Water ATM Dashboard
The console operators actually use every day
One screen for fleet status, sales and water quality across every Water ATM you run. Built from real operational needs on Hydrotec's own Arosia Water ATM network — not a generic analytics template.
Water ATM Network — Live
Illustrative
Machines Online
482 / 501
Litres Dispensed
1.84M
Revenue Today
$6,240
Avg. Water Quality
97.2%
Dispensing Volume — 7 days
Device Fleet
- ATM-0142New Delhi
- ATM-0143Konark
- PLANT-07Nashik
- ATM-0209Kasba, Kolkata
- SENSOR-14Khamar
- ATM-0301Ayodhya
The problem
Spreadsheets don't scale past a handful of machines
Most operators start tracking machines in a spreadsheet. It works until machine five, ten or fifty — then nobody has an accurate, current view of the fleet.
- Revenue figures reconciled days after the fact
- No alerting when a machine goes offline or a tank runs low
- Water quality readings recorded on paper, if at all
- No way to compare performance across sites
The Hydrotec approach
Everything an operator checks each morning, in one screen
The Water ATM Dashboard surfaces total machines, online/offline count, litres dispensed, revenue, active alerts and average water quality as soon as you log in — then lets you drill into any single site or machine.
Water Analytics — Benchmarking
Illustrative
Non-Revenue Water
11.4%
▼ 2.1 pts vs last quarter
Avg. Daily Consumption
1,240 L
Per active site
Reporting Coverage
100%
Daily / weekly / monthly
Consumption Trend — 90 days
Falling trend reflects fewer non-revenue litres, not lower demand.
Site Performance Index
From the field
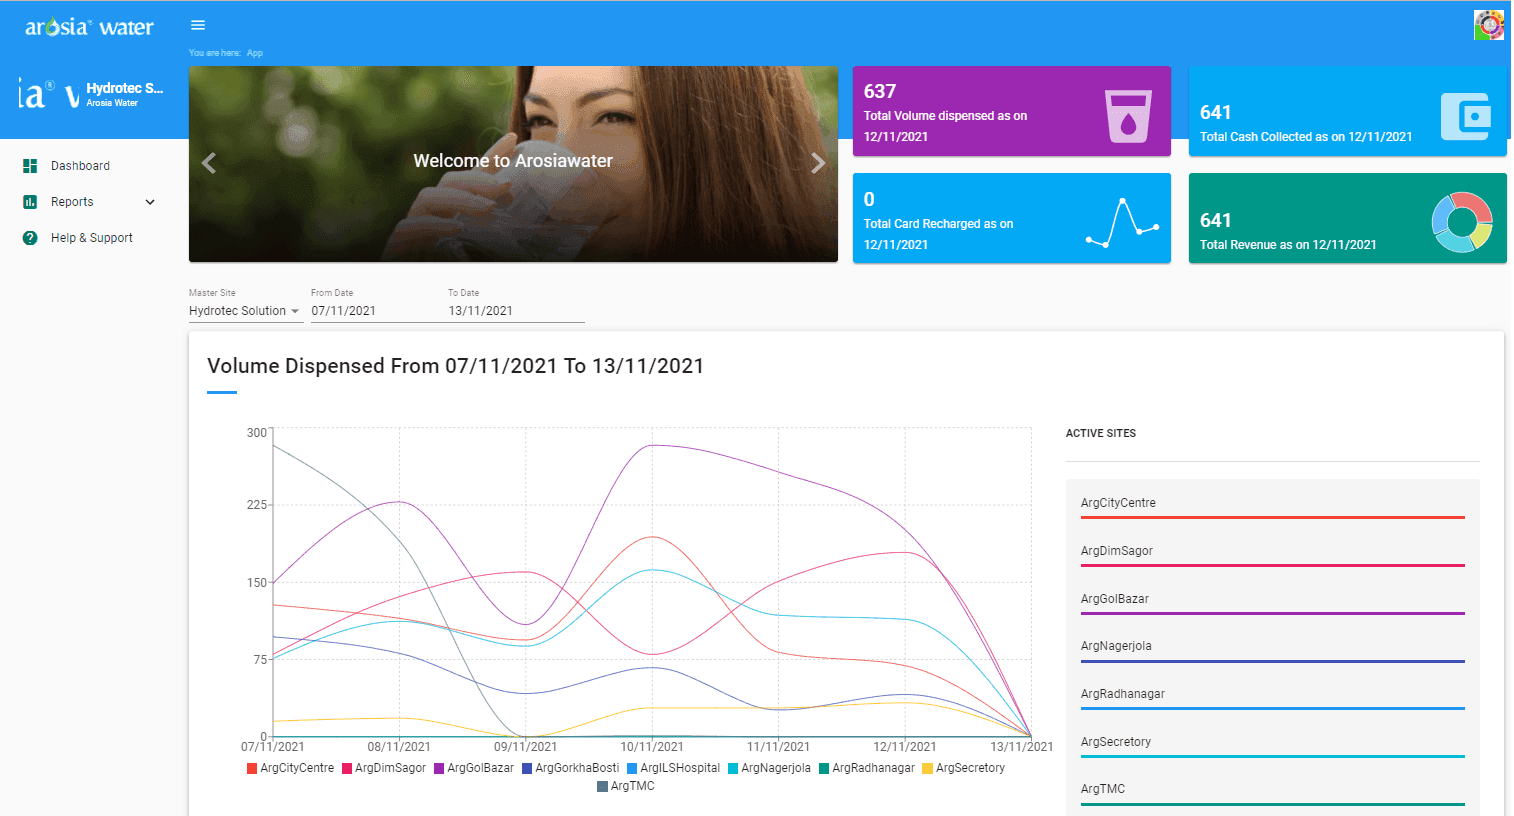
A screenshot from Hydrotec's Arosia Water operator dashboard, showing per-site dispensing volume across an active multi-site network. The production interface has evolved since this capture; the underlying metrics — volume, revenue, card recharges and per-site trends — remain the core of the dashboard today.
Features
What's included
Fleet overview
Total machines, online/offline counts and today's dispensing activity at a glance.
Site map
Every machine plotted geographically, colour-coded by status.
Revenue & trends
Daily, weekly and monthly revenue and volume trends per machine or site group.
Active alerts list
A prioritized list of machines needing attention — offline, low tank or quality out of range.
User & role management
Separate views for network administrators, regional managers and field technicians.
Exportable reports
Daily, weekly and monthly usage reports exportable for stakeholders and compliance.
Architecture
The dashboard is a view, not a silo
Every metric on the dashboard is available through the Water ATM API, so the same data can drive your own reporting or be embedded in another system.
Plants, networks, ATMs, tanks
Sensors, meters, controllers
Ingestion, storage, rules
REST & webhooks
Web operations console
Field & customer apps
Forecasts, anomalies
Use cases
Where this fits
Network operations
Day-to-day monitoring for teams running a multi-site Water ATM fleet.
Regional management
Compare performance across cities or territories from one login.
Investor & partner reporting
Export usage and revenue reports for stakeholders without manual compilation.
Technical detail
Data behind the dashboard
The dashboard reads from the same data model that powers the mobile apps and API.
- Machine status polled and pushed in near real time
- Revenue reconciled across RFID, coin and digital payment modes
- Water quality readings (pH, TDS) tied to machine and timestamp
- Historical data retained for trend and compliance reporting
Why it matters
Benefits
See problems before customers do
Offline and low-tank alerts surface immediately.
Reconcile revenue in minutes
Not days of manual cross-checking.
Compare sites fairly
Normalized metrics across machines of different ages and locations.
Report without extra work
Scheduled exports remove manual report-building.
FAQ
Common questions
Does the dashboard work on mobile browsers?
Yes, the operator dashboard is responsive. For field use, the dedicated Water ATM App is built for on-the-go maintenance and monitoring — see /water-atm-app/.
Can I see historical data, not just live status?
Yes — volume dispensed, revenue and quality readings are retained and available as daily, weekly and monthly trends per the current product specification.
Is the dashboard screenshot on this page the current interface?
It's a real screenshot from Hydrotec's Arosia Water dashboard. The interface has been refined since this capture, but the core metrics it displays — dispensing volume, revenue, card recharges and per-site activity — remain representative of what operators see today.
Can multiple regional managers have different views?
Yes, role-based access lets administrators scope what each user sees — by region, site group or machine.
Get started
See the dashboard on your own fleet
We'll show you how it looks configured for your machines and sites.